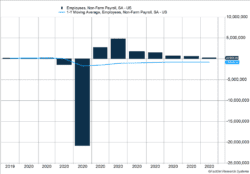
November turned out to be a month full of news. A surge of COVID-19 cases, the presidential election, vaccine announcements, and slowing economic growth all moved markets. The November employment report provided additional evidence economic growth is decelerating. The economy generated 245,000 new jobs, missing expectations of 463,000 (Figure 1). Unemployment inched lower to 6.7% supported by the slow job growth and more people leaving the labor force.
Key Points for the Week
- The S&P 500 gained nearly 11% last month and gained more than 10% for only the third time since 1993.
- Job growth slowed to 245,000 in November, providing further evidence of a COVID-led slowdown. Estimates were for 463,000 new jobs.
- The Chinese manufacturing economy continues to rebound based on Purchasing Manager Index data.
Chinese manufacturing data show the world’s second largest economy continues to accelerate. The Caixin Purchasing Managers Index for Manufacturing rose to 54.9 and increased the most since November 2010. Sales expanded at the fastest rate in 10 years.
Last month’s challenging economic news was overwhelmed by reports that two vaccine trials produced extremely strong results. The S&P 500 climbed 10.9% last month, and last week’s 1.7% rally pushed the index to another record high. The global MSCI ACWI index rose 1.5% last week and climbed 12.3% in November. The Bloomberg BarCap US Aggregate Bond Index slid 0.4% but finished the month 1.0% higher.
The U.S. Food and Drug Administration will review the first of the two successful vaccine trials this week. The second review is scheduled for Dec. 17. Should those two vaccines be approved, the U.S. will start deploying the vaccine very quickly. Great Britain has already approved one of the vaccines.
Figure 1
Are You Scared of Shots?
More than 20% of people have some fear of needles. For stock investors, November’s news about needles was nothing but positive. Powered forward by vaccines touting more than 90% effectiveness, the S&P 500 shot 10.9% higher last month and reached a record high. November’s enormous gain wasn’t the largest this year. The S&P 500 soared 12.8% in April after falling more than 20% in February and March. Prior to the two double-digit percentage gains this year, the only one since 1993 occurred in October 2011, following a string of five monthly declines.
The gains occurred despite declining economic momentum. The economy generated 245,000 new jobs last month. In a normal month, that would be a fantastic result, but there are still 9.8 million fewer people employed than there were at the end of February.
The slowing recovery has caused the number of permanently unemployed to reach 4.7 million, while those expecting to return to their jobs has shrunk from around 18 million to 2.8 million. Another concern is 36.9% of the unemployed have been out of work for more than 27 weeks. The percentage of long-term unemployed has nearly doubled since September. In order to get the long-term unemployed back to work fast enough, bigger gains are needed.
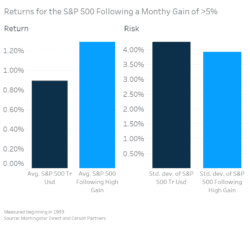
In addition to worrying about actual shots, some investors worry new highs or a sharp increase in stocks portend losses in the future. As seen in Figure 2, performance data suggest investors shouldn’t be any more worried than normal. Because there were only three monthly gains of more than 10%, we analyzed the returns in months following a gain of more than 5%. There have been 47 months since 1993 when the S&P 500 gained more than 5%. When this happens, stocks gain an average of 1.3% the following month, 0.4% higher than the average of all months over the same time period. Even more enticing, average volatility drops slightly.
Figure 2
Before signaling the all-clear, there are a couple factors that temper our optimism. Our contrarian nature makes us more concerned when other investors are chasing gains and investors seem highly optimistic. One measure of investor optimism is the ratio of option positions that benefit from the market falling compared to those that benefit from the market rising. Put options generally benefit when markets fall, while call options normally benefit when markets rise. The put-to-call ratio has moved to the lowest level in five years and sits about 33% lower than normal.
Investors should also keep in mind how far this market has moved. In 2020, the S&P 500 is 16.5% higher, and that is during a global pandemic. The index has rallied 67.4% since the low on March 23. The magnitude of that rally alone should point to the long-term benefits of investing and the benefits of managing the fear and euphoria markets can generate.
The Standard & Poor’s 500 Index is a capitalization-weighted index of 500 stocks designed to measure performance of the broad domestic economy through changes in the aggregate market value of 500 stocks representing all major industries.
—
This newsletter was written and produced by CWM, LLC. Content in this material is for general information only and not intended to provide specific advice or recommendations for any individual. All performance referenced is historical and is no guarantee of future results. All indices are unmanaged and may not be invested into directly. The views stated in this letter are not necessarily the opinion of any other named entity and should not be construed directly or indirectly as an offer to buy or sell any securities mentioned herein. Due to volatility within the markets mentioned, opinions are subject to change without notice. Information is based on sources believed to be reliable; however, their accuracy or completeness cannot be guaranteed. Past performance does not guarantee future results.
S&P 500 INDEX
The Standard & Poor’s 500 Index is a capitalization-weighted index of 500 stocks designed to measure performance of the broad domestic economy through changes in the aggregate market value of 500 stocks representing all major industries.
MSCI ACWI INDEX
The MSCI ACWI captures large- and mid-cap representation across 23 developed markets (DM) and 23 emerging markets (EM) countries*. With 2,480 constituents, the index covers approximately 85% of the global investable equity opportunity set.
Bloomberg U.S. Aggregate Bond Index
The Bloomberg U.S. Aggregate Bond Index is an index of the U.S. investment-grade fixed-rate bond market, including both government and corporate bonds
https://www.bls.gov/news.release/empsit.nr0.htm
https://www.markiteconomics.com/Public/Home/PressRelease/97a7429689ba4d94b649ec9ce93c04e5
https://www.nbcconnecticut.com/news/local/pfizer-moderna-vaccines-head-for-fda-review/2373069/
https://www.pbs.org/wgbh/nova/article/pfizer-moderna-covid-vaccines-clinical-trials/
Compliance Case: 00892578


