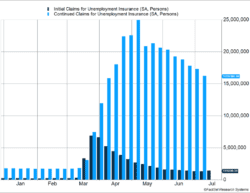
The increased number of COVID-19 cases appears to be pressuring employment in the U.S. Last week, the number of initial unemployment claims rose from 1.3 million to 1.4 million. (See Figure 1.) After slowly declining for weeks, the uptick shows signs of a weakening job market. New survey data from the Census Bureau showed a similar trend and indicated the July job report could be very weak.
Key Points for the Week
- Initial unemployment claims increased to 1.4 million last week as other short-term data indicated employment growth was slowing or reversing.
- Growth stocks have outperformed value stocks by a wide margin in the last year.
- S&P 500 earnings are coming in stronger than expected this quarter.
Governments around the world are looking to step into the gap. The European Union agreed to an aid package worth more than $800 billion. Much of the aid will flow to Southern European countries, which were hit harder by the virus and had weak economies prior to the crisis. Congress and the Trump administration are expected to work on another round of support for the U.S. this week.
Stocks barely budged last week. The S&P 500 dipped 0.3%. The global MSCI ACWI was basically unchanged, and bonds rallied. The Bloomberg BarCap Aggregate Bond Index climbed up 0.4% as yields continued to fall in response to the weaker job growth. Growth stocks have reached extreme levels of outperformance relative to value stocks. The Russell 1000 Growth has outperformed the Russell 1000 Value by 30.2% in the last 12 months.
S&P 500 companies are beating depressed earnings estimates. More than 80% of S&P 500 companies reporting so far have beaten expectations. Even with the improvement, earnings are expected to fall nearly 40% this quarter.
This week will be full of key economic data. The U.S. is expected to report its economy shrank by 9% last quarter and more than 30% on an annualized basis.
Figure 1
The Dog Days of Summer
Merriam-Webster defines the term “dog days” as the period between early July and early September as well as “a period of stagnation or inactivity.” Both definitions seem to be apt this year. The weather in many places has turned hot and humid. A slowdown in activity to curb the spread of the virus is weighing on the economic recovery in the U.S.
Figure 1 updates the initial and continuing unemployment claims. We’ve shared this chart many times as it provides a weekly update of unemployment trends in the U.S. The dark blue bars chart the number of people filing an initial unemployment claim the previous week. After peaking at around 6.8 million, it gradually slid to 1.3 million. Last week, it rose to 1.4 million and ended the downward trend. Our view is the increased number of coronavirus cases is causing many states to reinstate some social distancing rules. Perhaps even more powerfully, individuals are acting with greater care, and their social distancing actions are pressuring businesses and leading to workers being laid off.
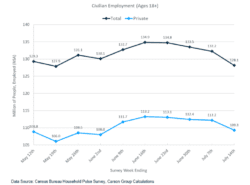
A relatively new tool from the Census Bureau, the Household Pulse Survey, estimates total civilian employment peaked around June 19 and had slid lower in recent weeks. As shown in Figure 2, private employment proved more resilient, but it has dipped in recent weeks, too.
Figure 2
Some of the difficulty comes from the expiration of certain government programs, such as the Paycheck Protection Program (PPP). This was designed to buy businesses and other organizations time by offering forgivable loans to keep people on the payroll. It worked well. One estimate says the PPP saved 2.3 million jobs.
The program’s duration banked on a sharp recovery in the job market and the economy sustaining the jobs after the program ended. For a couple months it looked like the recovery would come a little sooner than expected, but the recent increase in virus cases has made the jobs that were protected vulnerable again. Other programs, such as the $600 per week extra unemployment benefit, are also ending.
We expect the U.S. government to reach a deal in the next few weeks to extend some of these programs to buy the country more time to fight the increased number of cases. A package of $1-$1.3 trillion seems likely. Based on proposals the Trump administration and Republican-controlled Senate agreed to over the weekend, payments to individuals, enhanced unemployment benefits and potentially an additional round of PPP support to the hardest-hit businesses will likely be in the final package. The Democratic-controlled House is likely to negotiate other benefits that will push the final amount higher than the $1 trillion targeted by Republicans.
Key data releases this week will point to how far the economy has tumbled. The second quarter GDP report is widely expected to be the worst quarterly report since the government began tracking quarterly GDP shortly after World War II. Much of that decline occurred back in April and is relatively old news. Instead, decreased virus cases and indicators of safe reopening will be what helps the economy shake off the summer doldrums and return to stronger growth. For many facing unemployment, that can’t come too soon.
—
This newsletter was written and produced by CWM, LLC. Content in this material is for general information only and not intended to provide specific advice or recommendations for any individual. All performance referenced is historical and is no guarantee of future results. All indices are unmanaged and may not be invested into directly. The views stated in this letter are not necessarily the opinion of any other named entity and should not be construed directly or indirectly as an offer to buy or sell any securities mentioned herein. Due to volatility within the markets mentioned, opinions are subject to change without notice. Information is based on sources believed to be reliable; however, their accuracy or completeness cannot be guaranteed. Past performance does not guarantee future results.
S&P 500 INDEX
The Standard & Poor’s 500 Index is a capitalization-weighted index of 500 stocks designed to measure performance of the broad domestic economy through changes in the aggregate market value of 500 stocks representing all major industries.
MSCI ACWI INDEX
The MSCI ACWI captures large- and mid-cap representation across 23 developed markets (DM) and 23 emerging markets (EM) countries*. With 2,480 constituents, the index covers approximately 85% of the global investable equity opportunity set.
Bloomberg U.S. Aggregate Bond Index
The Bloomberg U.S. Aggregate Bond Index is an index of the U.S. investment-grade fixed-rate bond market, including both government and corporate bonds
https://www.merriam-webster.com/dictionary/dog%20days
https://insight.factset.com/sp-500-earnings-season-update-july-24-2020
https://www.frbatlanta.org/cqer/research/gdpnow
https://www.bbc.com/news/world-europe-53481542
https://www.wsj.com/articles/eu-leaders-close-in-on-coronavirus-recovery-plan-deal-11595274568
Compliance Case: 00789520


