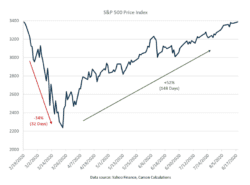
The S&P 500 continued to march higher, rising 0.8% last week. Excluding dividends, the index of large-cap U.S. stocks reached a new record. Some investors prefer this measure for determining when bear markets end. By almost any measure, the S&P 500 is no longer in a bear market. As Figure 1 shows, the decline to the lowest point took only 32 days, and the rally took only 148 days. The decline was the most rapid and the recovery the second-most rapid since World War II. The MSCI ACWI and the Bloomberg BarCap U.S. Aggregate Bond Index both rose 0.3%.
Key Points for the Week
- The S&P 500 rose 0.8% and hit a new high, even with dividends excluded. It marked the second fastest recovery, at just 148 days, since World War II.
- Housing starts reflected a strong sense of optimism in many segments of the economy.
- Initial unemployment claims rose 1.1 million after briefly dipping below 1 million last week.
The stock market rally continues despite economic data supporting our belief that the economic recovery is slowing. Initial unemployment claims jumped back above 1 million after dipping below that level for the first time since March. Purchasing Managers’ Index (PMI) data provided a more optimistic counterpoint as the services PMI in the U.S. climbed above 50 for the first time in six months.
The housing industry is bucking the trend toward slower economic growth. Housing starts rose 22.6% in July and are up 23.4% over the last year. Demand is close to pre-recession highs. Growth is most active in the Northeast and South, where it is above 30%. Existing home sales grew even faster, rising 24.7% in July. Low interest rates, favorable demographics, and a desire for more space seem to be fueling the market.
This week wraps up the political conventions as President Donald Trump makes his case for a second term after Vice President Joe Biden and the Democrats hosted their convention last week. Investors seem very concerned about the election inducing increased volatility. Yet, during the Democratic convention the S&P 500 never moved by more than 1% in a day.
Figure 1
A Special K?
The stock and housing markets are both broadcasting expectations for the economic recovery to accelerate in the new year. The S&P 500 price index, which excludes dividends, eclipsed the record high set on February 19 and erased the negative consequences of the COVID-19-induced bear market.
The bear market that began on February 20 lasted 180 days. As Figure 1 shows, the S&P 500 reached its low 32 days after the peak and took 148 days to eclipse the previous high. Dividends added more than 1% additional return to the index.
The rally has been driven largely by technology stocks. When the stock market reached its February high, the technology sector was responsible for more than half the 2020 increase in the S&P 500. But only two sectors, energy and materials, had a negative year-to-date return at the peak.
When the S&P 500 reached a similar level on August 18, more than 100% of the gain could be traded to technology. Six sectors were higher while five were lower, with financial stocks and energy detracting the most from the index. The gains in the five positive sectors, excluding technology, were not enough to overcome the losses in the five negative sectors.
The reach of technology is even stronger than the sector data would indicate. Internet retailers and social media companies have provided much of the gains in consumer discretionary and communication services sectors, which rank second and third for year-to-date contributions to the S&P 500’s performance.
The strength in technology is creating what some are calling a K-shaped recovery. As we have noted in previous weeks, the sharp recovery after a downturn, often called a V-shaped recovery is petering out with the increase in coronavirus cases and slowing pace of reopening. The K-shaped recovery reflects a sharp downturn in the vertical line and then a split, where some sectors are rebounding rapidly, while others continue to drift lower.
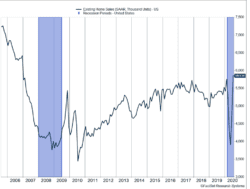
Another segment benefiting from the K-shaped recovery is housing. Figure 2 shows existing home sales have bounded higher than pre-recession levels as people have gotten the itch to move.
Figure 2
A few major factors have aligned to drive people to move. First, the ideal house for many people has shifted. People are spending far more time at home and want more space. For many of us, a home office has moved from a nice-to-have to a necessity. Second, millennials are at a prime age to establish residences. Third, the Federal Reserve has helped push mortgage rates on a 30-year mortgage below 3%. It is creating a powerful alignment supporting a housing rally.
New homes sales reflect a similar trend. Much of the demand for new homes is in the Northeast and the South, the two areas hardest hit by the virus. Demand in the West has been the weakest as housing costs have risen rapidly in several cities.
In the early 2000s, it was a slide in technology stocks, the 9/11 attack, and a decline in interest rates that helped fuel a strong housing market. Now, these two markets are moving together as a world with COVID-19 is creating a shift in what people do with their daily lives. The movement in these markets points to an even larger trend. People are open to making major changes to their lives and feel safe enough financially to do so. That provides evidence the recovery is likely to chug along and the disruptive power of COVID-19 is proving to be quite strong.
—
This newsletter was written and produced by CWM, LLC. Content in this material is for general information only and not intended to provide specific advice or recommendations for any individual. All performance referenced is historical and is no guarantee of future results. All indices are unmanaged and may not be invested into directly. The views stated in this letter are not necessarily the opinion of any other named entity and should not be construed directly or indirectly as an offer to buy or sell any securities mentioned herein. Due to volatility within the markets mentioned, opinions are subject to change without notice. Information is based on sources believed to be reliable; however, their accuracy or completeness cannot be guaranteed. Past performance does not guarantee future results.
S&P 500 INDEX
The Standard & Poor’s 500 Index is a capitalization-weighted index of 500 stocks designed to measure performance of the broad domestic economy through changes in the aggregate market value of 500 stocks representing all major industries.
MSCI ACWI INDEX
The MSCI ACWI captures large- and mid-cap representation across 23 developed markets (DM) and 23 emerging markets (EM) countries*. With 2,480 constituents, the index covers approximately 85% of the global investable equity opportunity set.
Bloomberg U.S. Aggregate Bond Index
The Bloomberg U.S. Aggregate Bond Index is an index of the U.S. investment-grade fixed-rate bond market, including both government and corporate bonds
Other data sourced via Factset
Compliance Case: 00809683


