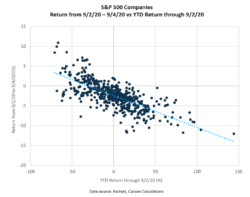
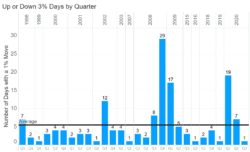
Investors were reminded stock investing comes with volatility as the S&P 500 dropped 3.5% on Thursday and declined 2.3% for the week. The downside pressure was felt most directly by stocks that had performed best. Figure 1 shows the best performing stocks this year (furthest to the right) lagged during the downturn (closest to the bottom). This year’s laggards for the year held up best. Thursday’s decline was the first 3% move this quarter but the 27th move of more than 3% this year. (See Figure 2.)
Key Points for the Week
- Volatility returned to the U.S. stock market as a sharp decline in technology stocks pushed the S&P 500 2.3% lower last week.
- Conditions for increased volatility have been in place for much of the rapid increase in U.S. stocks.
- The U.S. economy reclaimed 1.37 million jobs last month as unemployment dropped to 8.4%.
The U.S. employment report for August showed an economy experiencing slowing growth and continuing to add jobs. The economy regained 1.37 million jobs last month, roughly in line with expectations. A large number of temporarily unemployed workers returned to their jobs, which contributed to unemployment dropping to 8.4%. While many are returning to work, the number of permanently unemployed increased by 534,000. Because of the long layoffs and slow recovery for many industries, 60% of the unemployed have been out of work for more than 15 weeks.
The S&P 500’s drop of 2.3% should be kept in perspective. The index of large U.S. companies had increased 3.3% the previous week. The MSCI ACWI also fell 2.3% last week. The Bloomberg BarCap U.S. Aggregate Bond Index gained 0.8% as bonds continue to provide diversification benefits to investors.
Market volatility will be this week’s focus as we see whether investors remain anxious to reorient portfolios after a tough week in the sectors, such as technology, that performed best over the last year. Economic data will provide insight into whether prices are increasing as supply chains and business models adjust to a COVID reality. China and the U.S. both release Consumer Price Index data this week.
Figure 1
Employment Performance Appraisal
Some investors are asking, where did last week’s volatility come from? A better question would be, what took so long? Global stocks, led by the U.S. and technology stocks, have been able to overcome the losses from the sharp February-March downturn and rally to record highs. For most of the period, volatility had been above average. In recent weeks, markets had calmed, making the swift return to volatility even more shocking.
As we noted in previous commentaries, there are many reasons we expect above-average volatility from this market:
- New COVID-19 cases remain high; social distancing measures seem able to tamp down cases, only to see them increase later.
- Stock investors seem to be paying less attention to the near term and focused further into the future than normal, driving up price-to-earnings ratios to levels not seen since the aftermath of the tech bubble.
- The potential effectiveness of vaccines provides additional uncertainty. Companies more reliant on in-person activity would benefit the most from a very effective vaccine, and technology companies seem better positioned to weather vaccines with mixed effectiveness.
- The S&P 500 is up 58.1% from the March low. When markets rise this quickly, it creates an environment where investors jumping in late can also jump out quickly and create emotion-led volatility.
Given the strength of the rally from the lows, the market has provided a very high reward for absorbing the volatility last week and additional weeks like it. The gains being given back aren’t that old as the S&P 500 increased 3.3% the previous week. The volatility we are experiencing is still much less than what markets experienced earlier this year. As Figure 2 shows, last Thursday’s 3.5% decline was the 27th move of more than 3% this year.
Figure 2
The stock market’s rally in recent months anticipated an improving economic situation, which last week’s jobs report provided. The August employment report indicated 1.37 million jobs were created or regained from the previous month. Government payrolls increased 344,000, supported by the hiring of 238,000 census workers. Payrolls have recovered around half the job losses so far.
A separate survey indicated the labor market was showing additional strength. Unemployment dropped to 8.4%. The number of people classifying themselves as temporarily unemployed dropped by 3 million. Unfortunately, some of those who thought their unemployment would be temporary now see it as permanent, meaning they no longer expect to be rehired into their previous positions. Much of the 500,000 increase in the permanently unemployed came from this group.
In a previous weekly update, we laid out our key economic theme of a slower economic recovery, punctuated with variations of strength and weakness based on virus control and other factors. This employment report follows that theme, although it was a bit stronger than expected. August’s net gain of 1.37 million jobs was less than July’s 1.7 million and June’s 4.8 million. Gains are slowing, and we expect them to continue to as long as the increased risk of virus spread looms over any reopening decisions.
The combination of a slow recovery and high uncertainty contributes to an environment where last week’s volatility should be expected to continue. The rally in recent months has reflected our key market theme that investors are looking past an earnings slowdown and forward to a recovery. The volatility will likely increase if investors start to shorten their horizon. Stay patient.
—
This newsletter was written and produced by CWM, LLC. Content in this material is for general information only and not intended to provide specific advice or recommendations for any individual. All performance referenced is historical and is no guarantee of future results. All indices are unmanaged and may not be invested into directly. The views stated in this letter are not necessarily the opinion of any other named entity and should not be construed directly or indirectly as an offer to buy or sell any securities mentioned herein. Due to volatility within the markets mentioned, opinions are subject to change without notice. Information is based on sources believed to be reliable; however, their accuracy or completeness cannot be guaranteed. Past performance does not guarantee future results.
S&P 500 INDEX
The Standard & Poor’s 500 Index is a capitalization-weighted index of 500 stocks designed to measure performance of the broad domestic economy through changes in the aggregate market value of 500 stocks representing all major industries.
MSCI ACWI INDEX
The MSCI ACWI captures large- and mid-cap representation across 23 developed markets (DM) and 23 emerging markets (EM) countries*. With 2,480 constituents, the index covers approximately 85% of the global investable equity opportunity set.
Bloomberg U.S. Aggregate Bond Index
The Bloomberg U.S. Aggregate Bond Index is an index of the U.S. investment-grade fixed-rate bond market, including both government and corporate bonds
https://www.worldometers.info/coronavirus/country/us/
https://www.cnbc.com/2020/09/04/jobs-report-august-2020-.html
https://www.nature.com/articles/d41573-020-00151-8
All data from FactSet or Morningstar Direct
Compliance Case: 00820882


