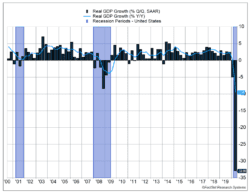
U.S. GDP fell 32.9% last quarter on an annualized basis. It wasn’t as bad as it looks. Annualizing the data magnifies the decline by assuming the trend will continue for a full year. A better assessment can be gained by comparing GDP to the same quarter last year. Using this measure, the U.S. economy shrank 9.5%. Even the lower number is staggering. During the global financial crisis, the economy slowed just 4% based on a similar measure. (Please see Figure 1.)
Key Points for the Week
- U.S. GDP dropped 32.9% annualized in the second quarter and is 9.5% lower than one year ago.
- Services and clothing sales each dropped more than 40%, while auto sales rebounded in the second quarter.
- The S&P 500 rallied 5.6% in July on broad gains.
Much of the damage to second quarter GDP was done early in the quarter. Income and consumption data for June showed activity is rebounding but remains well below pre-crisis levels. Personal consumption expenditures rose 5.6% in June.
The Federal Reserve met last week and left its policies unchanged while emphasizing Congress must act to control the virus and pass fiscal policy, which will matter more than monetary policy in coming months.
Stocks continued to rally. The S&P 500 added 1.8%, raising its year-to-date gain to 2.4%. The global MSCI ACWI edged 0.7% higher. The Bloomberg BarCap Aggregate Bond Index climbed 0.3% as the weak economic data and the Fed meeting suggested interest rates would stay low for an extended period. July produced strong results for investors. The S&P 500 rose 5.6% and the MSCI ACWI gained 5.3%.
The U.S. employment report will likely be the most watched economic event this week. Estimates are for 1.4 million jobs added in July. That is only 30% of the number added in June, and the high rate of initial unemployment claims makes the data even more uncertain.
Figure 1
Ouch!
The 32.9% decline in U.S. GDP marked the largest slide since the government began to measure quarterly GDP in 1947. As mentioned above and shown in Figure 1, annualized GDP data magnifies the decline by projecting economic trends to continue for a full year.
Economists’ expectations are the opposite. GDP is expected to bounce back 18% in the third quarter. One way to better measure the effect of the pandemic is to compare GDP to where it was one year prior. Based on this measure, GDP is 9.5% lower.
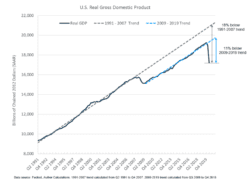
This measure understates the damage by ignoring the fact that the economy would have likely grown without the pandemic and ensuing recession. Figure 2 seeks to overcome this challenge by measuring GDP relative to the recent economic growth trend. The economy is now 11% below its 2009-2019 growth trend.
Figure 2
Another important question is how quickly and how far the economy will bounce back. The expected rebound next quarter would make up around one-third of the gap between current GDP and the recent trend. If the economy continues to bounce back and the virus is better controlled, the fourth quarter and future quarters should create a faster growth rate than the previous trend, making up for lost ground. Without better virus control through social distancing, our expectation is growth will be tepid until a vaccine is developed.
Figure 2 also underscores the power of the 2008-2009 recession. The financial crisis was very damaging economically because after the recession ended, the post-crisis growth rate decelerated rather than accelerated. The lack of accelerating growth means the economy never made up the lost ground. The longer the pandemic lasts, the more permanent we expect the economic damage to be.
The GDP report showed pockets of strength and extreme weakness. Services dropped 43.5% and were much weaker than goods, which declined 11.3%. Health care, transportation, restaurants and hotels, and recreation all fell between 60% and 95%. The data also showed signs of how the post-COVID world has increased demands for certain goods. Recreational vehicles (RVs) and related goods rose 40.5% and auto production surged 5.5%. Public transportation and carpooling to school seem less attractive options in a new era, raising the demand for automobiles.
The eurozone reported an even larger decline than the U.S. Second-quarter GDP was 15% lower than one year ago. This masks other data suggesting its economy may be poised to rebound more quickly than in the U.S. Europe’s efforts to control the virus have been more successful, and unemployment has increased far less in Europe as aid packages were more successful at keeping workers in their jobs.
As jobs data comes out next week, we are reminded the challenges to the economy will become easier to manage when the virus is better controlled. Fed Chairman Jerome Powell noted in his press conference, “I think we feel that it might be the most central factor or the most central driver of the path of the economy is the virus.” Further declines in the number of new U.S. cases may influence markets as much as the job numbers next week and in weeks to come.
—
This newsletter was written and produced by CWM, LLC. Content in this material is for general information only and not intended to provide specific advice or recommendations for any individual. All performance referenced is historical and is no guarantee of future results. All indices are unmanaged and may not be invested into directly. The views stated in this letter are not necessarily the opinion of any other named entity and should not be construed directly or indirectly as an offer to buy or sell any securities mentioned herein. Due to volatility within the markets mentioned, opinions are subject to change without notice. Information is based on sources believed to be reliable; however, their accuracy or completeness cannot be guaranteed. Past performance does not guarantee future results.
S&P 500 INDEX
The Standard & Poor’s 500 Index is a capitalization-weighted index of 500 stocks designed to measure performance of the broad domestic economy through changes in the aggregate market value of 500 stocks representing all major industries.
MSCI ACWI INDEX
The MSCI ACWI captures large- and mid-cap representation across 23 developed markets (DM) and 23 emerging markets (EM) countries*. With 2,480 constituents, the index covers approximately 85% of the global investable equity opportunity set.
Bloomberg U.S. Aggregate Bond Index
The Bloomberg U.S. Aggregate Bond Index is an index of the U.S. investment-grade fixed-rate bond market, including both government and corporate bonds
https://www.washingtonpost.com/business/2020/07/30/gdp-q2-coronavirus/
https://www.cnn.com/2020/07/31/economy/europe-economy-gdp-recession/index.html
Compliance Case: 00794419


